Vietnam's industrial electricity tariffs have increased by an average of 8–12% per year over the past five years, and the Ministry of Industry and Trade has signaled continued increases through 2030 as part of the energy sector reform roadmap. For energy-intensive industries, the cooling system is often the second-largest electricity consumer after the production process itself.
This article quantifies the savings opportunities available from cooling system efficiency upgrades in the context of rising EVN tariffs.
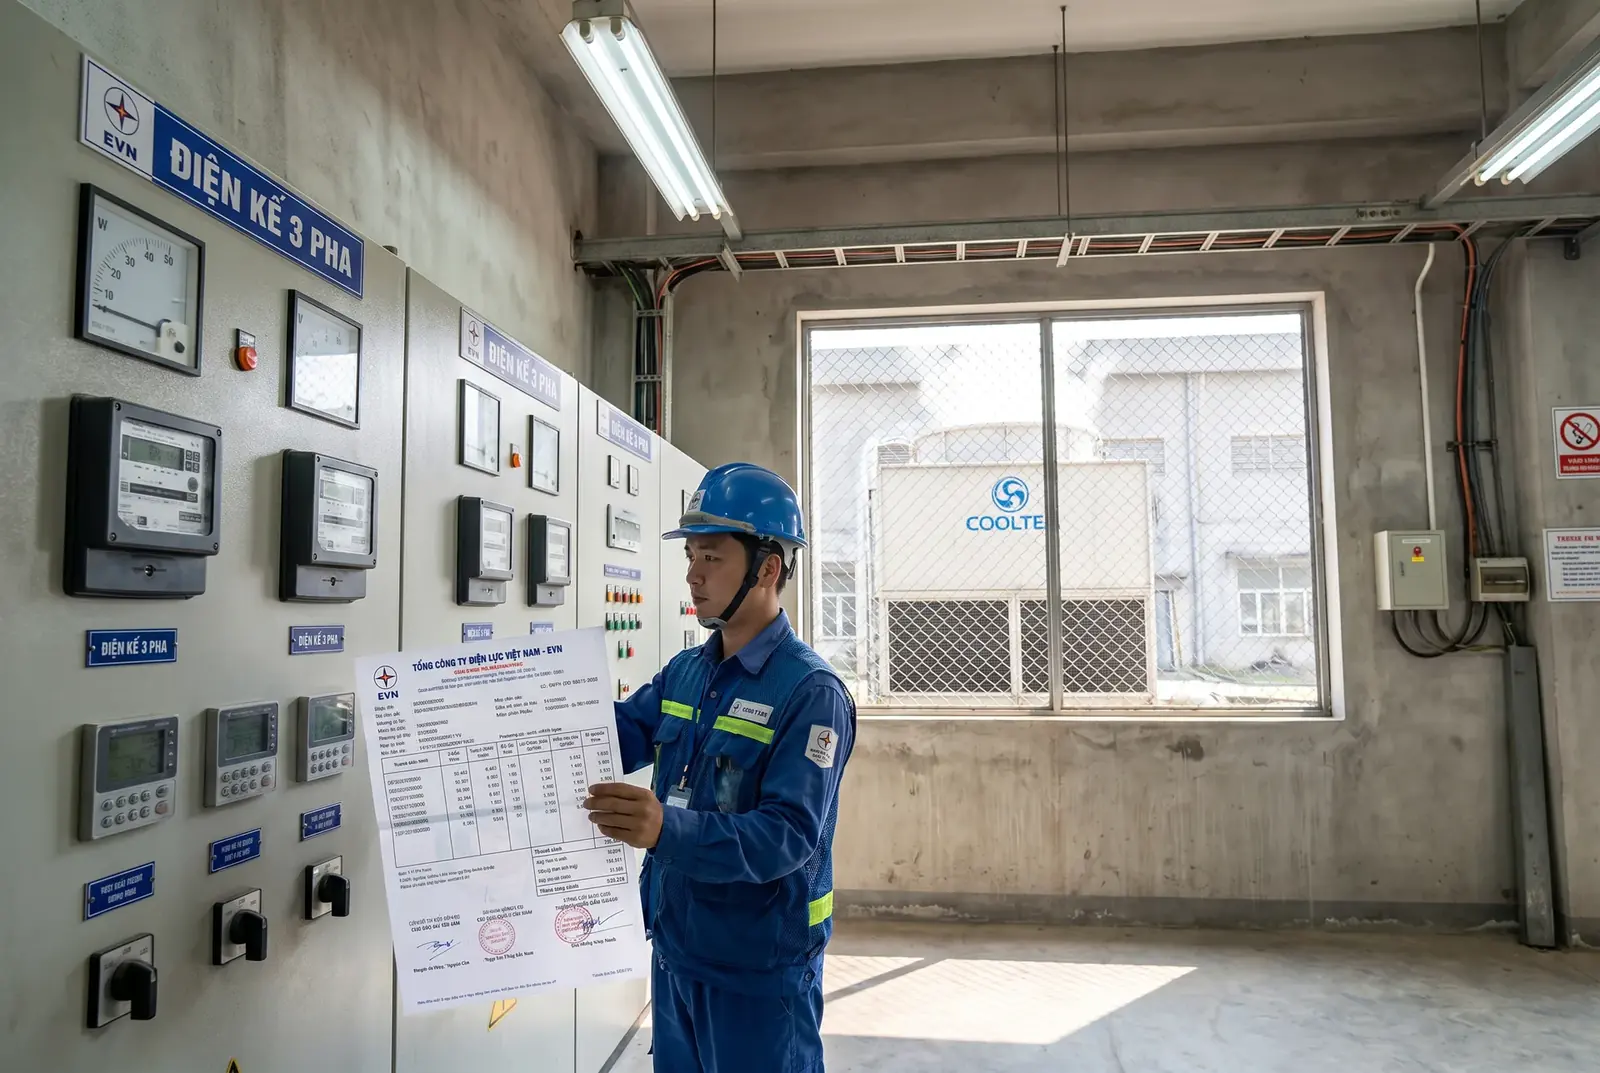
With EVN industrial electricity tariffs increasing by 8–12% per year, the annual cost of operating an inefficient cooling system grows proportionally — making efficiency upgrades increasingly attractive.
1. The Cooling System's Share of Industrial Electricity Consumption
1.1 Typical Energy Breakdown
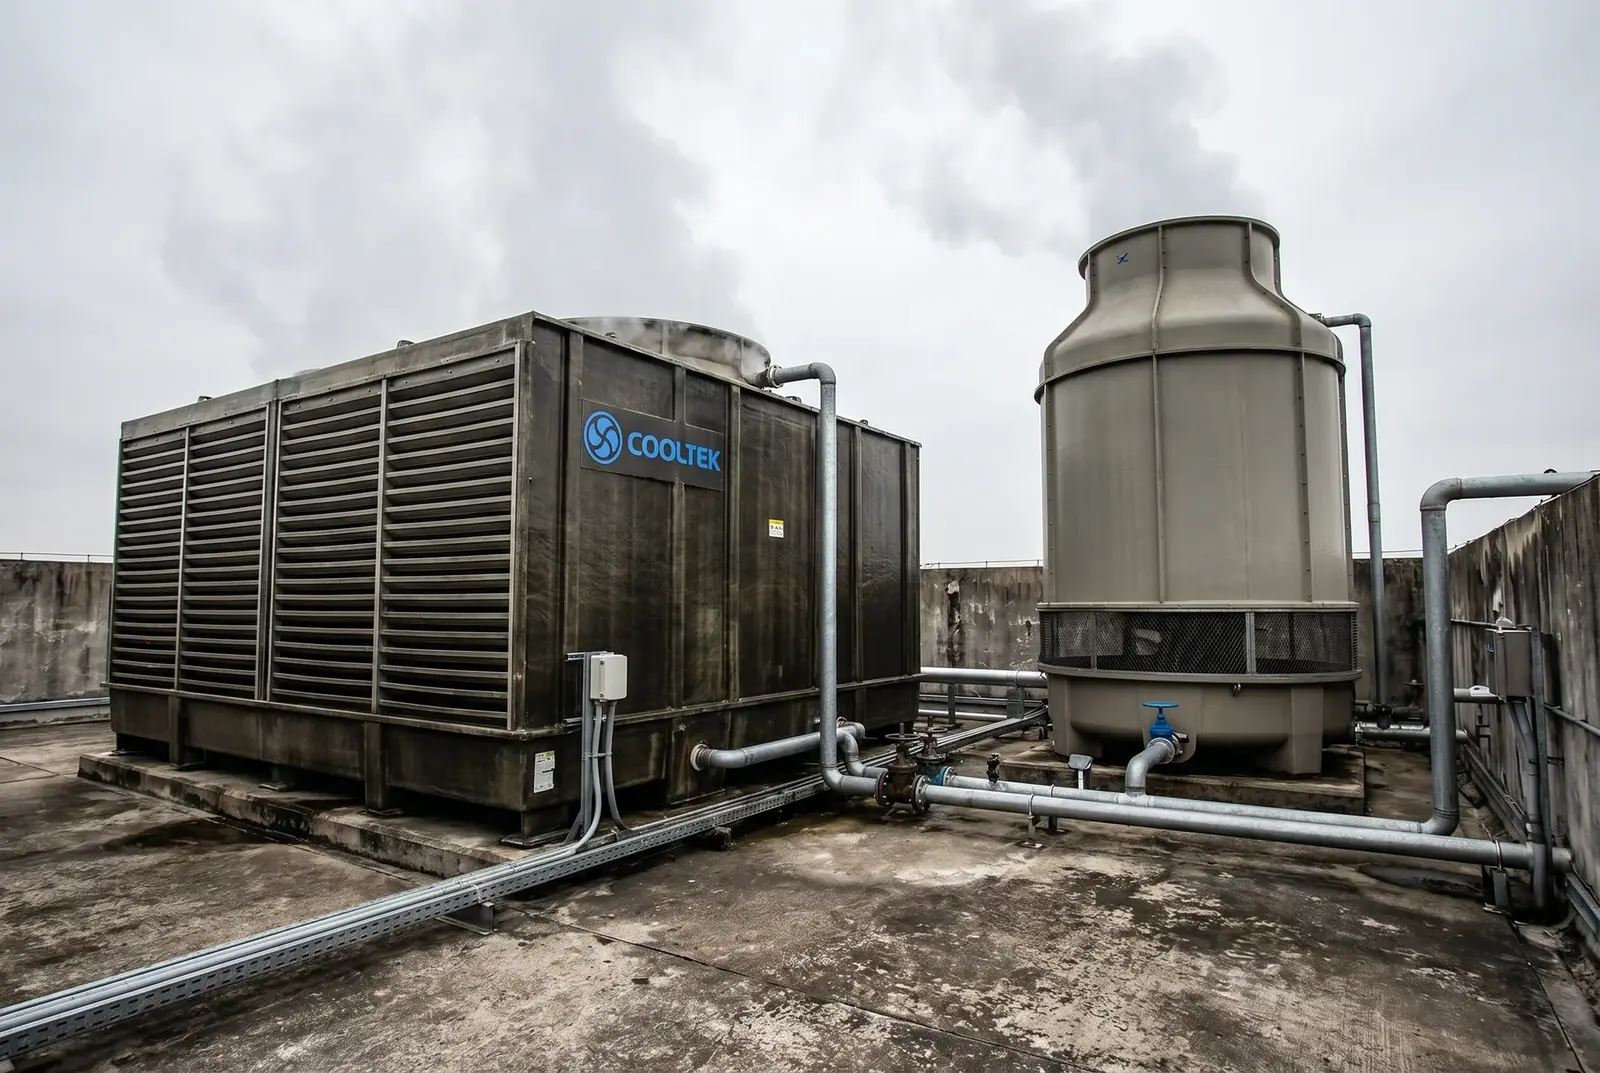
For a typical Vietnamese industrial plant, the cooling system accounts for the following share of total electricity consumption:
| Industry Sector | Cooling System Share of Total Electricity | Primary Cooling Load |
|---|---|---|
| Food and beverage processing | 15–25% | Process cooling, refrigeration |
| Pharmaceutical manufacturing | 20–35% | HVAC, process cooling, clean room |
| Plastics and rubber | 25–40% | Mold cooling, process cooling |
| Electronics manufacturing | 30–45% | Clean room HVAC, process cooling |
| Chemical processing | 20–35% | Reactor cooling, condenser cooling |
1.2 Cooling Tower vs. Chiller Energy Split
Within the cooling system, energy is consumed by three main components:
- Chiller compressor: 60–70% of cooling system electricity (for chilled water systems)
- Cooling water pump: 15–20% of cooling system electricity
- Cooling tower fan: 5–10% of cooling system electricity
Cooling tower efficiency upgrades directly reduce pump and fan energy, and also improve chiller COP by providing colder condenser water — creating a multiplier effect on total cooling system energy savings.
2. Savings Opportunities from Cooling Tower Upgrades
2.1 Pump Energy Savings from Pressure Drop Reduction
As detailed in the pressure drop savings article, replacing a counterflow tower with an LHR crossflow tower reduces water-side pressure drop by 30–60 kPa. Annual pump energy savings for different system sizes:
| System Flow Rate (m³/h) | Pressure Drop Reduction (kPa) | Annual Pump Saving (kWh) | Annual Cost Saving at 2025 EVN Rate |
|---|---|---|---|
| 200 | 40 | 23,700 | 52.1M VND (~2,100 USD) |
| 500 | 40 | 59,300 | 130.5M VND (~5,200 USD) |
| 1,000 | 40 | 118,500 | 261.0M VND (~10,400 USD) |
2.2 Fan Energy Savings from Fill Replacement
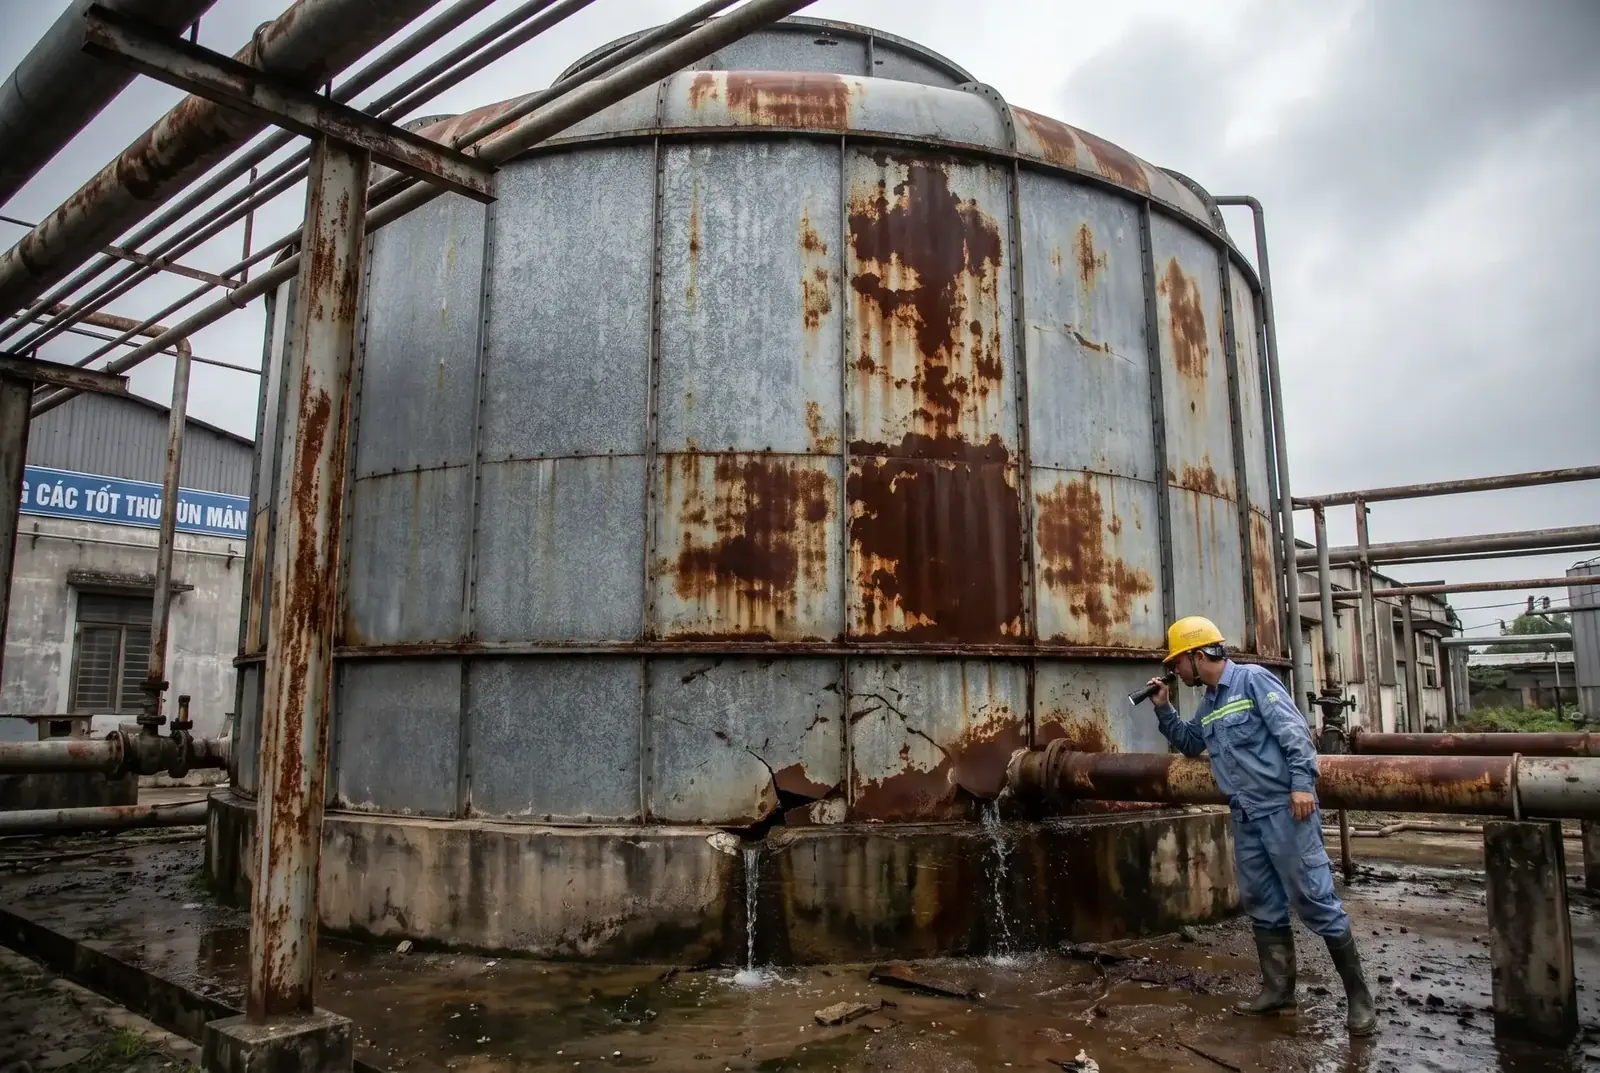
Degraded fill increases air-side resistance, forcing the fan to work harder. Replacing 10-year-old fill with new fill typically reduces fan power by 15–25%:
- For a tower with a 15 kW fan motor, 20% power reduction = 3 kW saving
- Annual energy saving: 3 kW × 8,000 h = 24,000 kWh/year
- Annual cost saving: 24,000 × 2,200 VND = 52.8 million VND/year (~2,100 USD)
2.3 Chiller COP Improvement from Colder Condenser Water
Every 1°C reduction in cooling tower outlet water temperature improves chiller COP by approximately 2–3%. For a 500 kW chiller operating at COP 4.0, a 2°C improvement in condenser water temperature:
- New COP: 4.0 × (1 + 0.025 × 2) = 4.2
- Power reduction: 500 kW ÷ 4.0 − 500 kW ÷ 4.2 = 125 − 119 = 6 kW
- Annual energy saving: 6 kW × 8,000 h = 48,000 kWh/year
- Annual cost saving: 48,000 × 2,200 VND = 105.6 million VND/year (~4,200 USD)

Pressure drop reduction, fan efficiency improvement, and chiller COP improvement are three independent savings streams that compound to create a significant total annual saving.
3. Impact of EVN Tariff Increases on Savings Value
With EVN tariffs projected to increase 8–12% per year through 2030, the annual savings in VND terms grow proportionally each year. For a 500 m³/h system with total annual energy savings of 100,000 kWh:
| Year | EVN Blended Rate (VND/kWh) | Annual Saving (VND million) | Cumulative 10-Year Saving (VND million) |
|---|---|---|---|
| 2025 (Year 1) | 2,200 | 220 | 220 |
| 2027 (Year 3) | 2,640 | 264 | 726 |
| 2030 (Year 6) | 3,520 | 352 | 1,848 |
| 2035 (Year 11) | 5,170 | 517 | 3,960 |
Note: Assumes 10% annual EVN tariff increase. Actual increases may vary.
The cumulative 10-year savings from cooling system efficiency upgrades grow significantly as EVN tariffs increase, making the investment case stronger each year.
Reference standards: EVN Decision No. 648/QD-EVN (2024) electricity tariff schedule; Vietnam Ministry of Industry and Trade electricity pricing roadmap 2024–2030; ASHRAE 2019 HVAC Systems and Equipment Chapter 40; ISO 9906 rotodynamic pumps hydraulic performance acceptance tests.