When evaluating cooling tower options, engineers often focus on the thermal performance (approach temperature, cooling range) while overlooking the water-side pressure drop. Yet pressure drop is a direct multiplier on pump energy consumption — a component that runs continuously throughout the year.
This article provides a step-by-step calculation of annual savings from reducing water-side pressure drop by 10 kPa, using current EVN electricity tariffs and typical industrial system parameters.
Water-side pressure drop is a direct multiplier on pump energy consumption. Every 10 kPa reduction in pressure drop translates to measurable annual electricity cost savings.
1. The Physics of Pressure Drop and Pump Power
1.1 Basic Relationship
The hydraulic power required to overcome a pressure drop is:
P (kW) = Q (m³/s) × ΔP (Pa) ÷ η_pump
Where:
- Q = volumetric flow rate of cooling water
- ΔP = pressure drop to be overcome
- η_pump = pump efficiency (typically 0.70–0.80 for industrial centrifugal pumps)
1.2 Calculation Example: 300 m³/h System
For a cooling water system with the following parameters:
- Flow rate: 300 m³/h = 0.0833 m³/s
- Pressure drop reduction: 10 kPa = 10,000 Pa
- Pump efficiency: 0.75
- Annual operating hours: 8,000 h/year
Power reduction: P = 0.0833 × 10,000 ÷ 0.75 = 1.11 kW
Annual energy saving: 1.11 kW × 8,000 h = 8,880 kWh/year
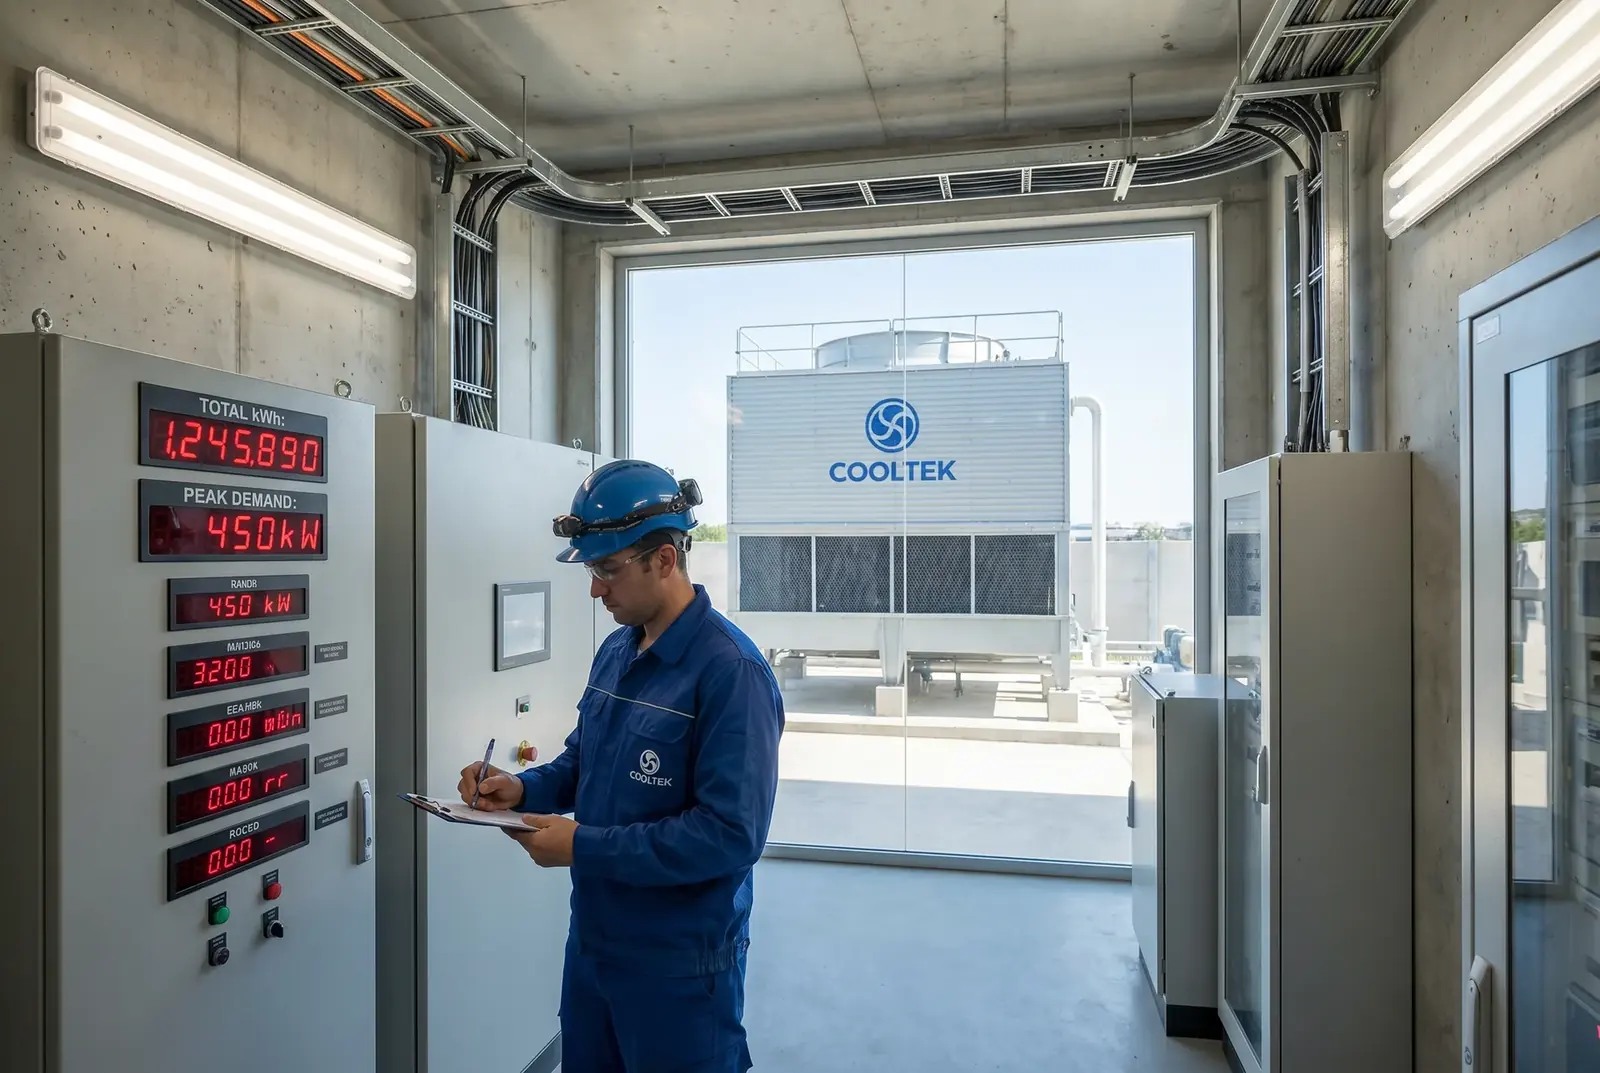
2. Annual Cost Savings at EVN Tariffs
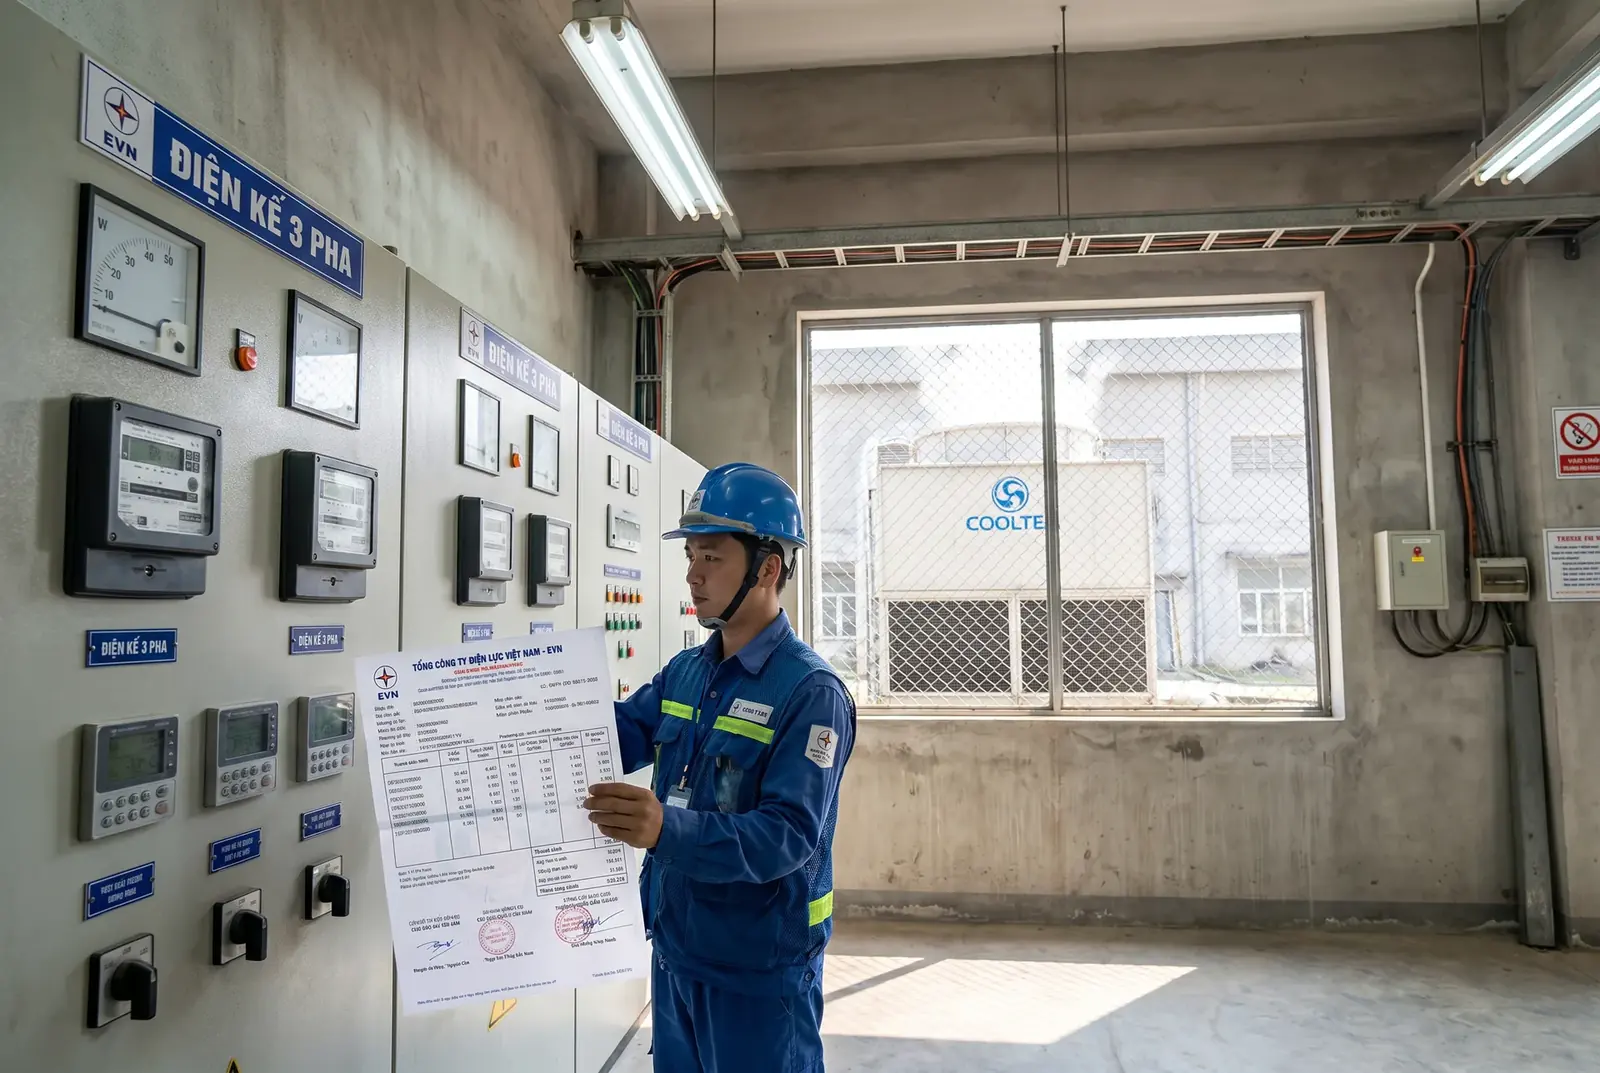
2.1 EVN Industrial Electricity Tariffs (2025)
| Tariff Tier | Rate (VND/kWh) | Applicable Hours |
|---|---|---|
| Peak hours (9:30–11:30, 17:00–20:00 weekdays) | ~3,500 | ~1,500 h/year |
| Normal hours | ~2,100 | ~5,000 h/year |
| Off-peak hours (22:00–04:00) | ~1,000 | ~1,500 h/year |
| Blended average | ~2,200 | 8,000 h/year |
2.2 Annual Savings by System Size
| Flow Rate (m³/h) | Power Reduction (kW) | Annual Energy Saving (kWh) | Annual Cost Saving (VND million) | Annual Cost Saving (USD) |
|---|---|---|---|---|
| 100 | 0.37 | 2,960 | 6.5 | ~260 |
| 200 | 0.74 | 5,920 | 13.0 | ~520 |
| 300 | 1.11 | 8,880 | 19.5 | ~780 |
| 500 | 1.85 | 14,800 | 32.6 | ~1,300 |
| 1,000 | 3.70 | 29,600 | 65.1 | ~2,600 |
Note: Assumes pump efficiency 0.75, 8,000 operating hours/year, blended EVN rate 2,200 VND/kWh, exchange rate 25,000 VND/USD.
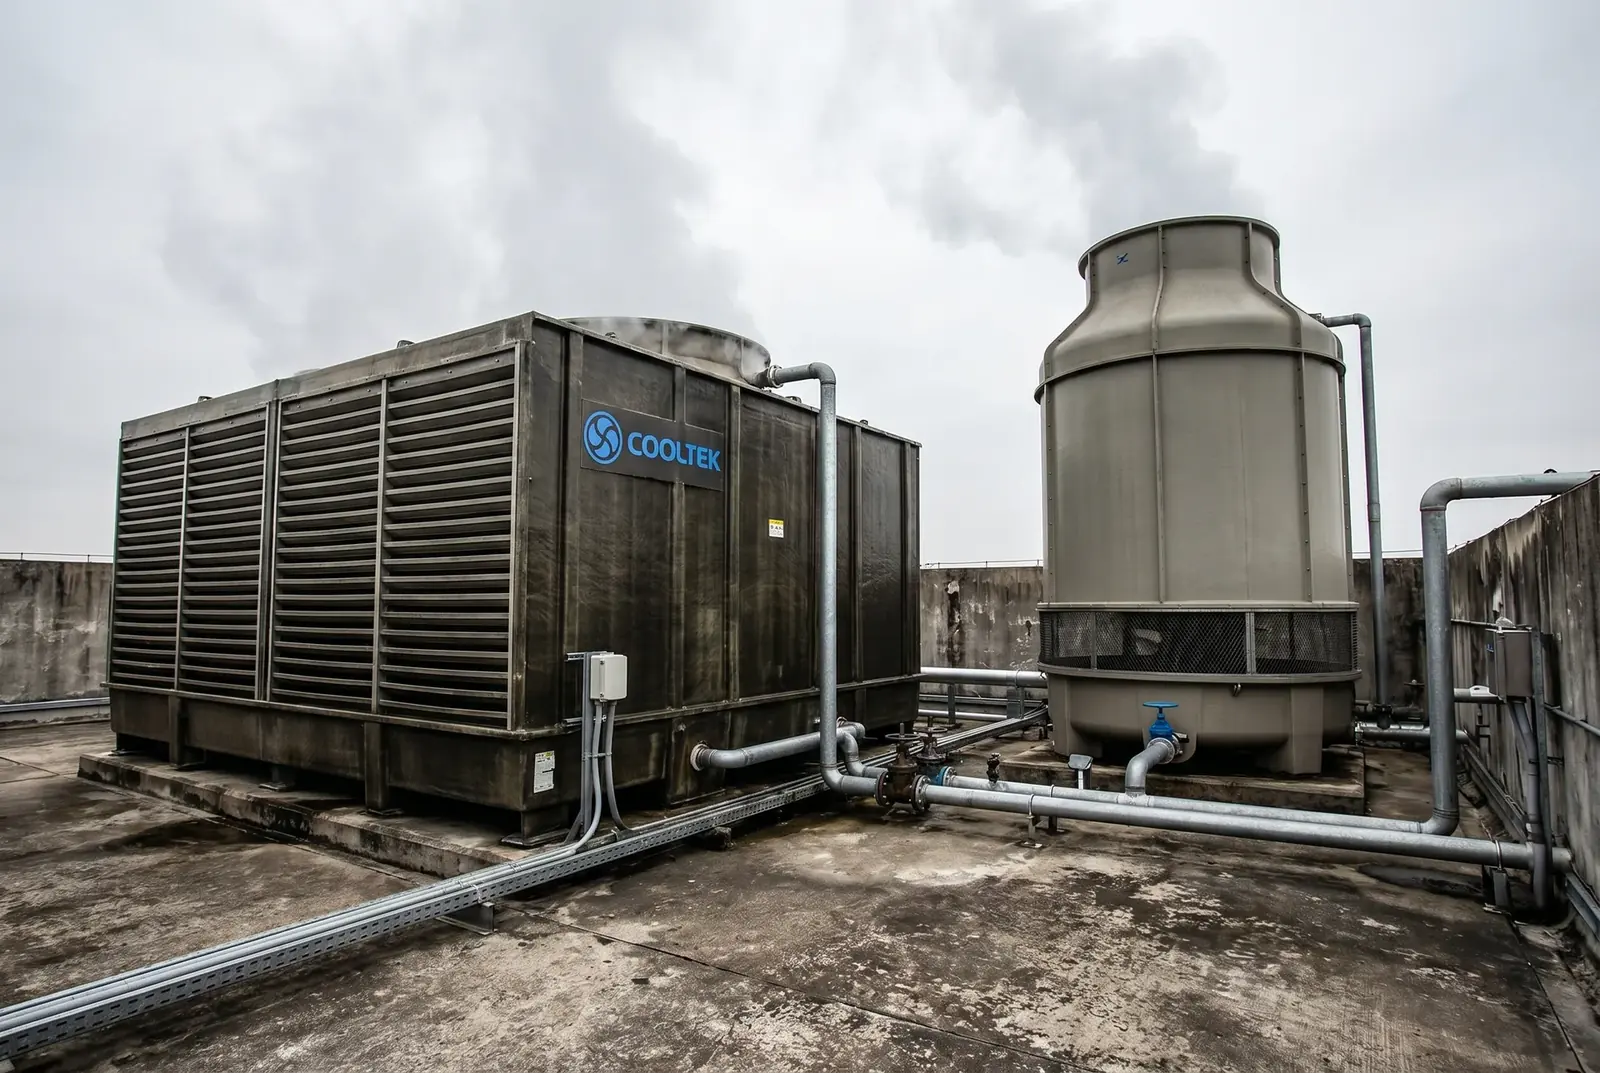
3. Pressure Drop Comparison: LHR vs. Counterflow Towers
3.1 Typical Pressure Drop Values
The water-side pressure drop of a cooling tower includes: static head (water elevation), nozzle pressure (for counterflow towers), and fill resistance. Typical values:
| Tower Type | Nozzle Pressure | Fill Resistance | Total Pressure Drop |
|---|---|---|---|
| Round counterflow tower | 30–50 kPa | 10–20 kPa | 60–100 kPa |
| Square counterflow tower | 25–40 kPa | 10–20 kPa | 55–90 kPa |
| LHR crossflow tower | 0 (gravity basin) | 10–20 kPa | 20–40 kPa |
The difference between LHR crossflow and standard counterflow is 30–60 kPa — equivalent to 3–6 times the 10 kPa increment used in the calculation above.
With EVN electricity tariffs increasing by an average of 8–12% per year, the annual cost savings from pressure drop reduction grow proportionally each year.
4. Payback Period Calculation
For a 300 m³/h system replacing a counterflow tower (pressure drop 80 kPa) with an LHR crossflow tower (pressure drop 30 kPa), the pressure drop reduction is 50 kPa = 5 × 10 kPa increments:
- Annual energy saving: 5 × 8,880 kWh = 44,400 kWh/year
- Annual cost saving: 44,400 × 2,200 VND = 97.7 million VND/year (~3,900 USD/year)
- Price premium of LHR vs. counterflow: approximately 15–25% higher initial cost
- Typical payback period: 2–4 years from pump energy savings alone
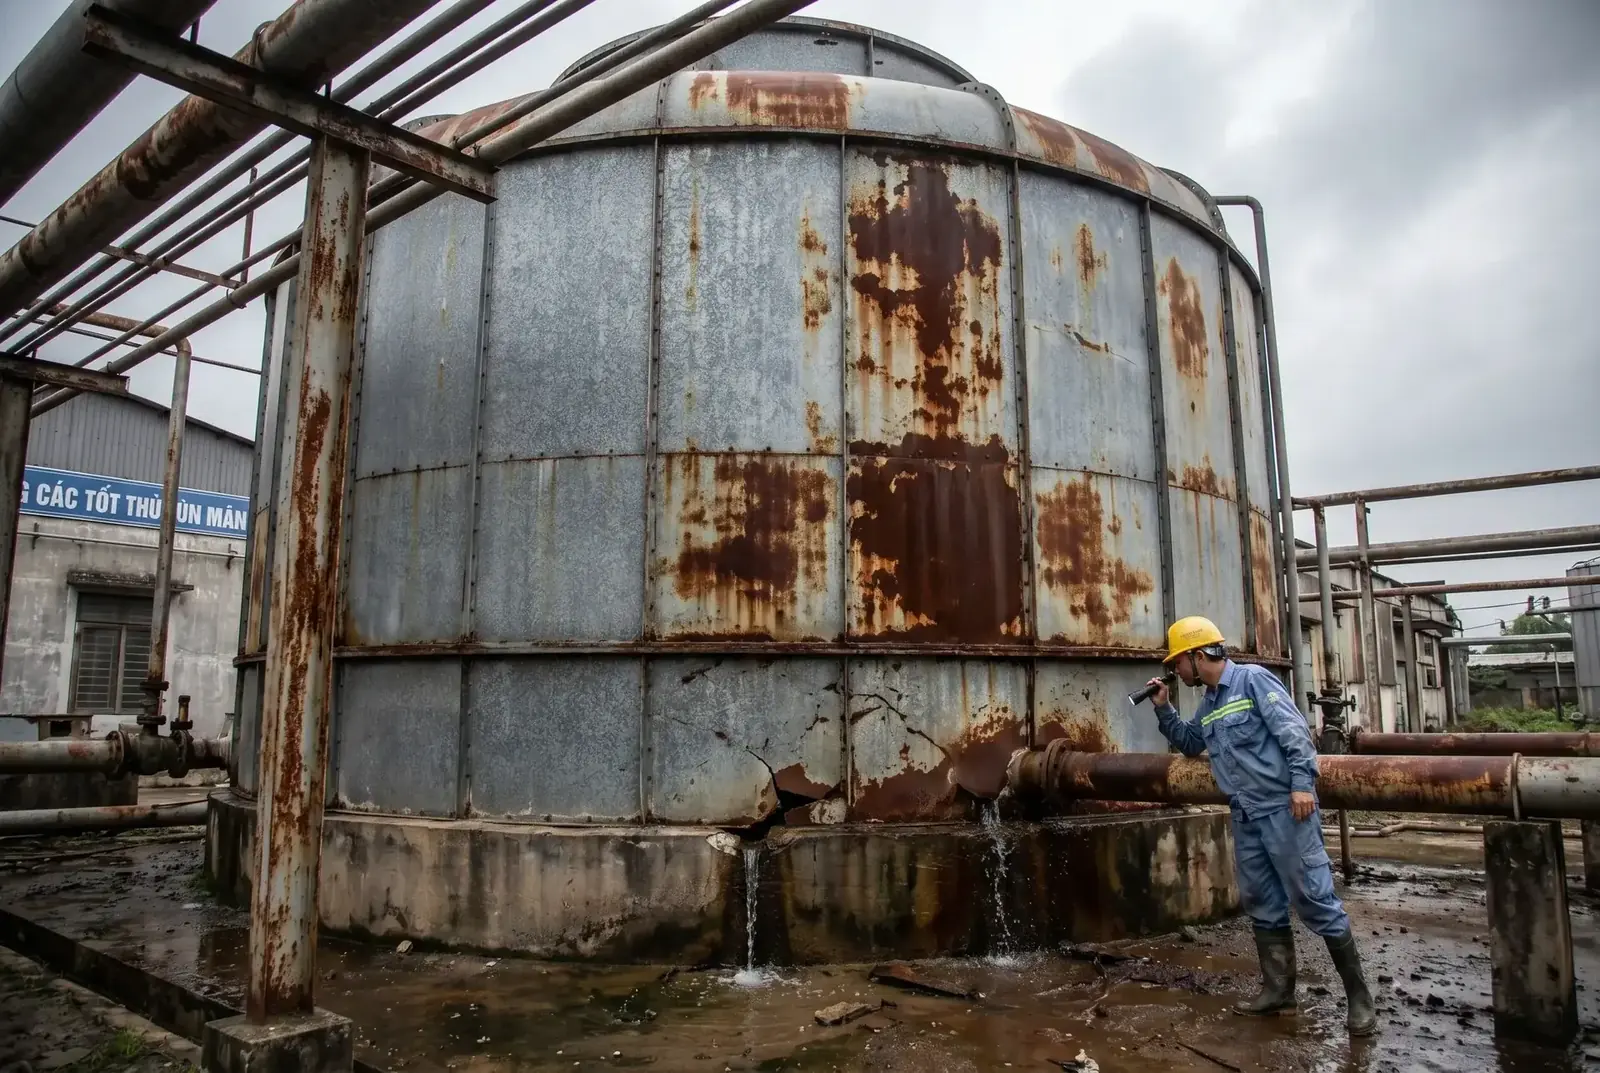
When pump energy savings are combined with reduced maintenance costs and extended service life, the total ROI of switching to LHR crossflow typically exceeds 200% over 10 years.
Reference standards: EVN Decision No. 648/QD-EVN (2024) electricity tariff schedule; ISO 9906 rotodynamic pumps — hydraulic performance acceptance tests; ASHRAE 2019 HVAC Systems and Equipment Chapter 40.